
Reticulated filter foam is not a sieve. A 30 PPI foam does not stop every particle larger than its openings and let every smaller particle through. Dust is captured throughout the depth of the strut network, by several physical mechanisms at once, with a probability that depends on particle size, air velocity, foam thickness and how much dust is already held.
This is why a PPI number alone cannot be turned into a micron rating, and why an airflow resistance figure means little without its test conditions. It is also why two performance datasheets can only be compared when they describe the same thing measured the same way.
This guide explains how reticulated foam captures dust, where the boundary between PPI and filtration precision lies, how thickness and air velocity affect pressure drop, and how to read and compare performance data.
For an overview of reticulated foam as an air pre-filtration material, see Reticulated Foam Filter Media: A Guide to Air Pre-Filtration.
Key Takeaways
Reticulated foam is a depth-loading filter. Particles are captured on struts throughout the foam, not only at the surface.
Capture works through several mechanisms: straining, inertial impaction, interception and diffusion. Particles smaller than the openings can still be captured.
PPI is not a micron rating. A meaningful precision claim states an efficiency, a particle size and a test method.
At equal thickness and test conditions, a higher PPI generally captures more dust and creates more airflow resistance.
Pressure drop grows with thickness and grows faster than linearly with air velocity at typical operating speeds.
Performance data can only be compared under the same test method, thickness, face velocity, test dust and loading state.
1. How Does Reticulated Foam Capture Dust?
Short answer: Air passing through reticulated foam follows a winding path around the struts. Particles leave the air stream and stick to the struts by straining, inertial impaction, interception and diffusion. Capture happens throughout the thickness of the foam, which is why reticulated foam is described as a depth-loading filter rather than a surface filter.
Depth Loading, Not Surface Sieving
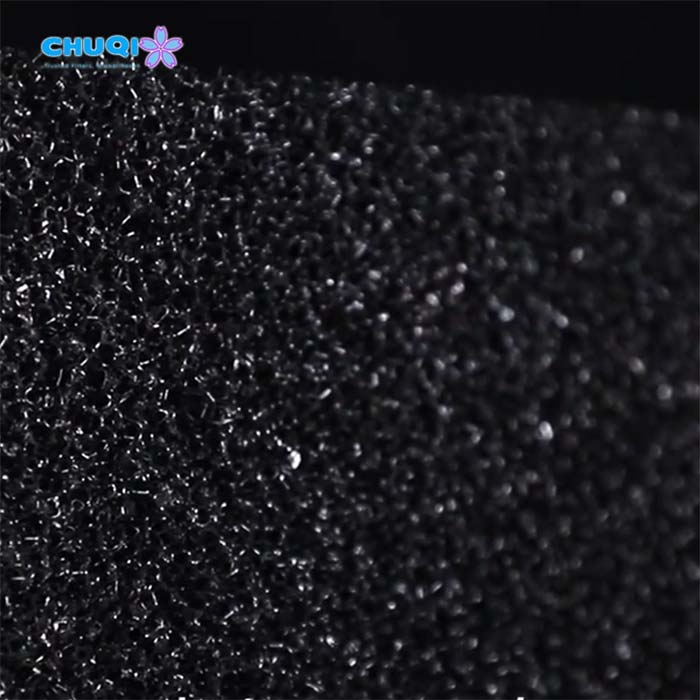
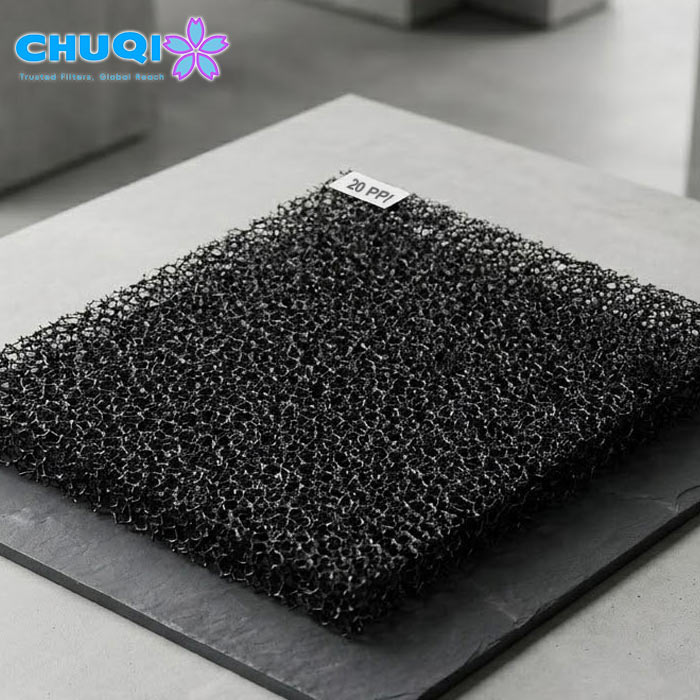
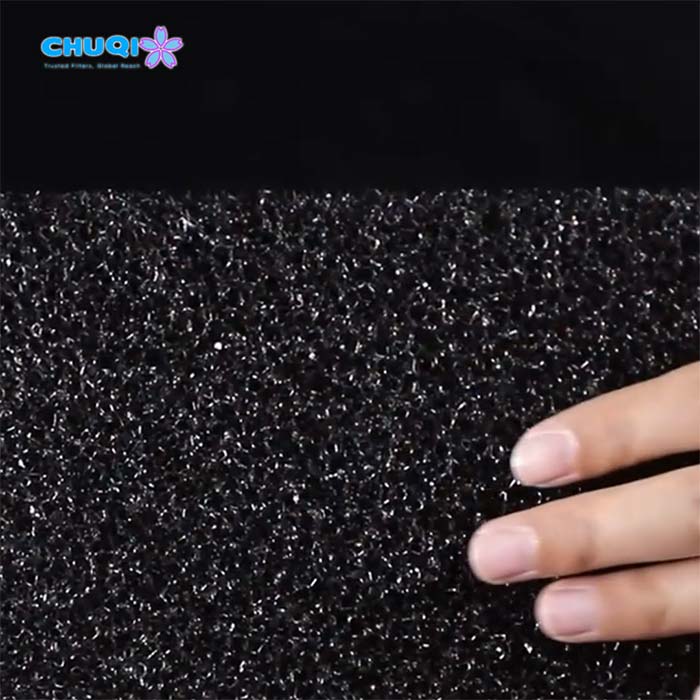
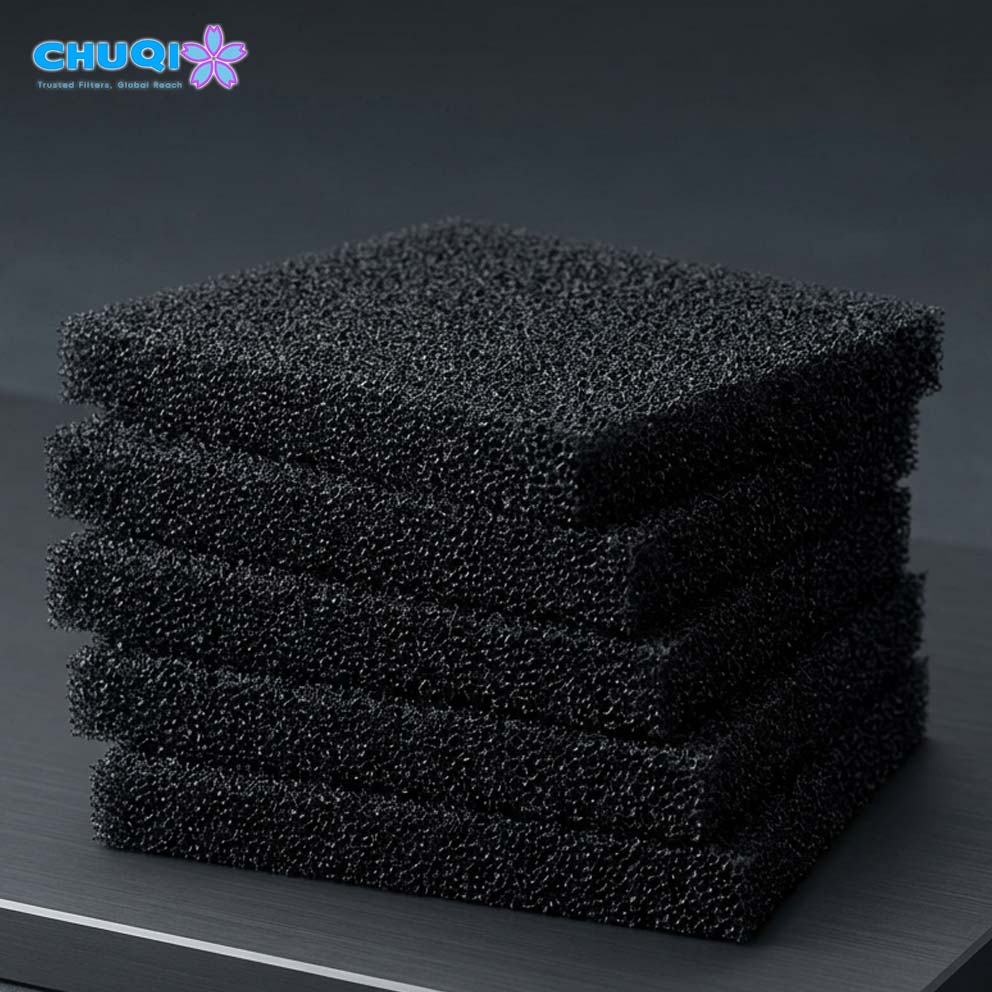
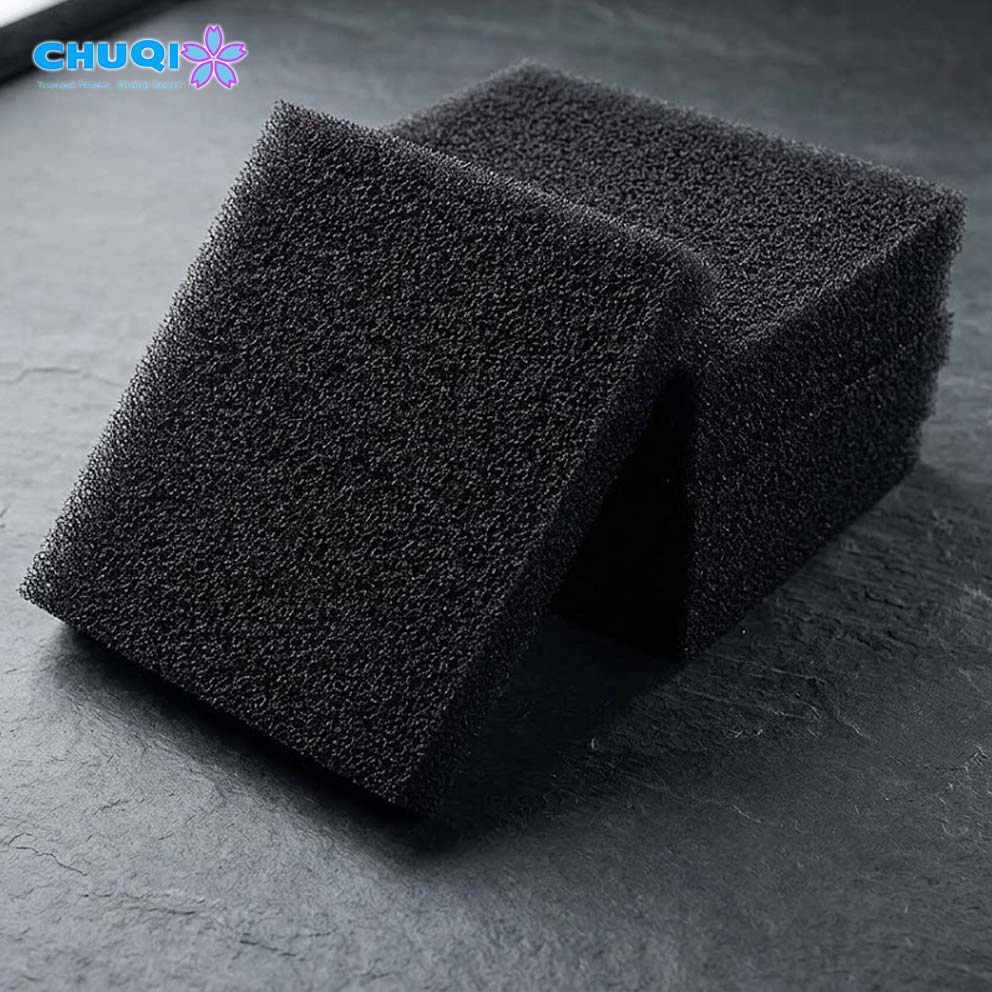
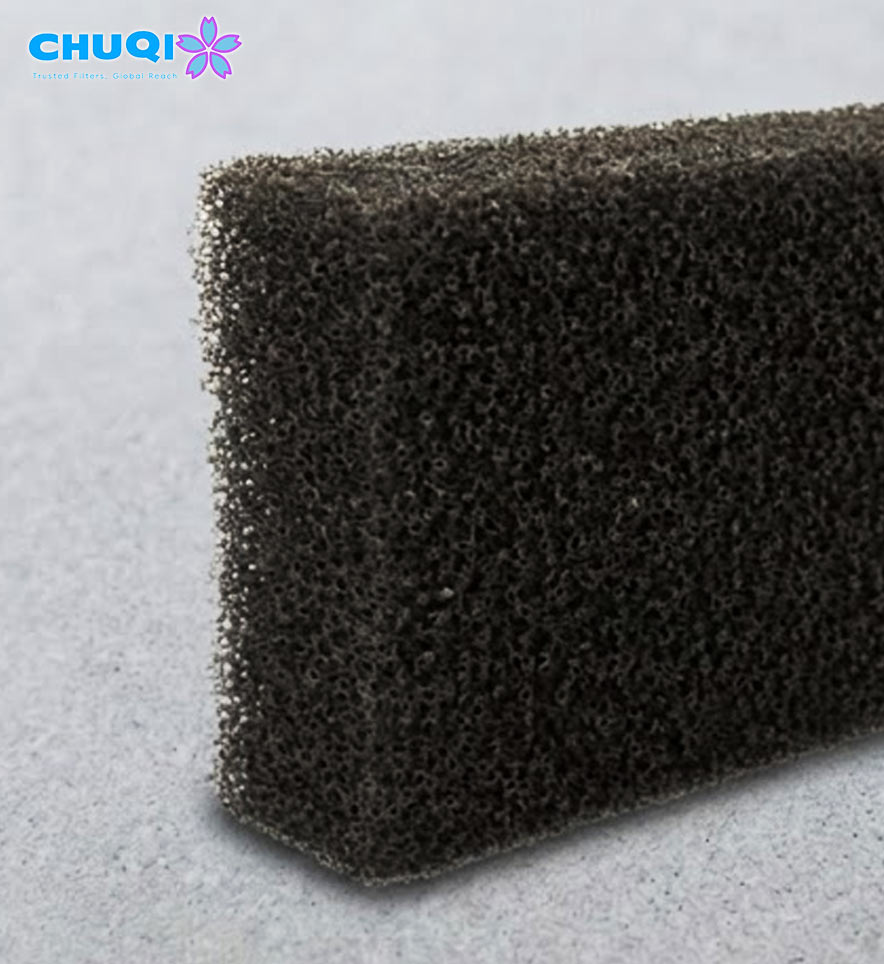
Once the cell membranes are removed, what remains is a network of struts that forms a tortuous path for air and dust. Dust particles are trapped inside the cells across the depth of the material, rather than forming a layer on the face of the filter. The skeletal structure gives a large strut surface area on which particles can be collected.
How the strut network is created, and how it differs from ordinary foam, is covered in Reticulated Filter Foam vs Regular Sponge: What Is the Difference?.
The Four Capture Mechanisms
| Mechanism | How it works | Particles it affects most |
|---|---|---|
| Straining (sieving) | A particle is larger than the gap it tries to pass through and is physically blocked | The largest particles relative to the openings |
| Inertial impaction | The air turns around a strut; a heavier particle keeps moving in a straight line and hits it | Larger, denser particles, typically above about 0.5–1 µm |
| Interception | A particle follows the air stream but passes close enough to a strut to touch it and stick | Mid-sized particles |
| Diffusion | Very small particles move randomly (Brownian motion) and collide with struts | Very fine particles, typically below about 1 µm |
These mechanisms act together. Particles smaller than the filter’s openings can still be retained, so a depth filter does not behave like a sieve.mcmaster+1
What Influences Capture
Particle size and density. Larger and denser particles are more likely to be captured by impaction.
Air velocity. Impaction becomes more effective as velocity rises, because particles carry more momentum. Higher velocity also increases resistance (see Section 4).
Cell size (PPI). Finer cells and thinner struts create more and closer collection surfaces along the air path.
Thickness. A thicker layer gives each particle more chances to be captured (see Section 3).
Dust already held. As dust builds up inside the foam, the open space between struts is reduced. This changes both capture and airflow resistance.
What Happens as the Foam Loads
As captured dust fills the cells, the airflow resistance rises. Test standards describe this with three values:
Initial resistance: the clean filter’s resistance.
Final resistance: the resistance at which the test, or service, ends.
Dust holding capacity: the total weight of test dust the filter captures up to that end point.
Because reticulated foam loads through its depth, dust-holding behavior depends on thickness as well as PPI.
2. Why Is PPI Not a Micron Rating?
Short answer: PPI counts pores along one inch. Filtration precision describes how much of a given particle size is captured under defined conditions. Because capture is probabilistic and depends on velocity, thickness and loading, a foam does not have a single cut-off size. A credible precision claim states an efficiency, a particle size, and the test method and conditions.
Why There Is No Single Cut-Off Size
A sieve has a cut-off: particles above a certain size are blocked, and those below pass. A depth filter does not. For any given foam, the share of particles captured rises gradually with particle size, and the whole curve shifts when conditions change:
The same foam captures differently at a different air velocity.
A thicker layer of the same foam captures more.
A partly loaded foam captures differently from a clean one.
This is why a single micron number attached to a PPI grade, without conditions, cannot describe how the foam will perform.
What PPI Does Tell You About Performance
PPI does indicate a direction. When thickness and test conditions are equal, a higher-PPI foam generally captures a larger share of dust and also takes more pressure to push air through. A higher PPI therefore trades more capture for more resistance. How much more of each depends on the conditions and must be measured.
Research on reticulated polyurethane foams has also found that filtration efficiency rose with both PPI and thickness. In that study, for fungal spores, PPI had roughly twice the influence of thickness. Results like this apply to the conditions tested, but they show that PPI and thickness both have to be considered.
3. How Does Thickness Affect Airflow Resistance and Dust Capture?
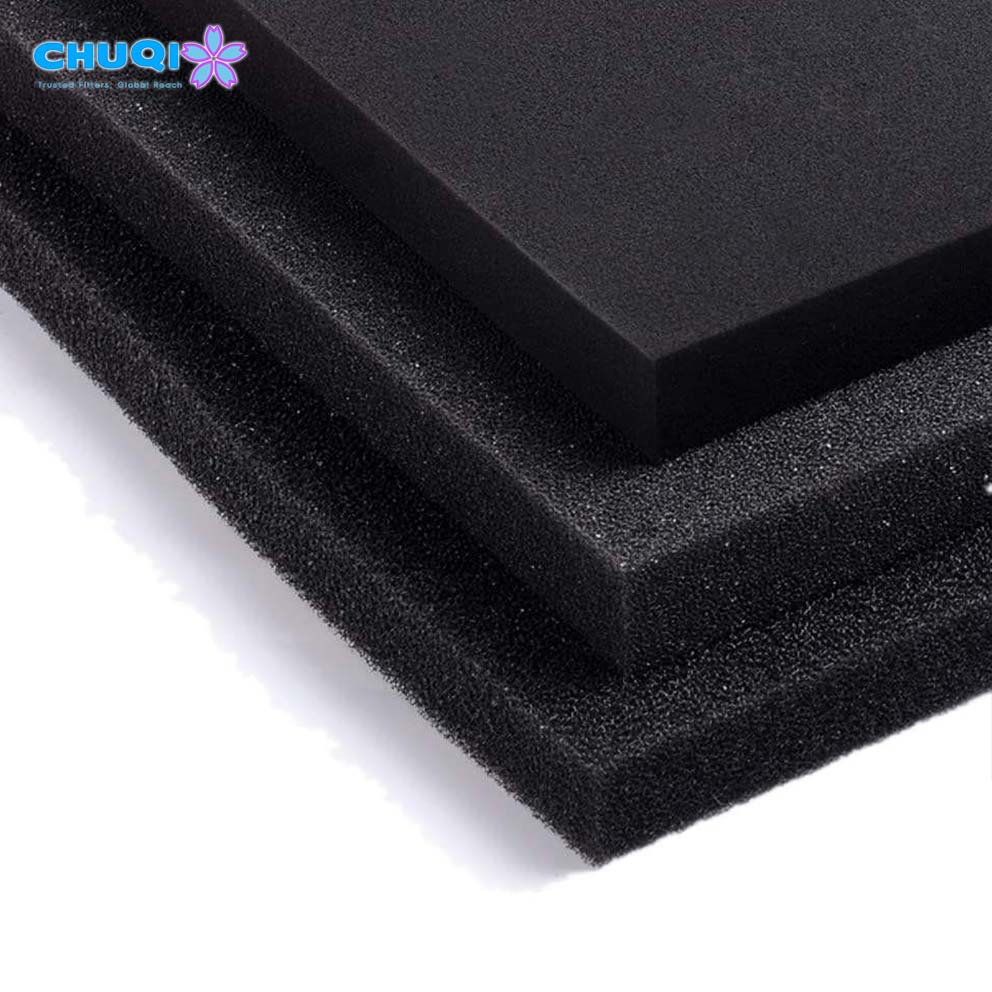
Short answer: At the same PPI and air velocity, a thicker foam gives air a longer path through the strut network. Resistance increases roughly in proportion to thickness, particles get more opportunities to be captured, and there is more volume to hold dust. Thickness therefore affects resistance, capture and dust-holding together, and data measured at one thickness should not be applied to another.
Pressure Drop and Pressure Gradient
For a uniform foam at a given velocity, a useful working quantity is the pressure gradient: pressure drop divided by thickness, in Pa per mm or Pa per m. If the gradient is constant, doubling the thickness roughly doubles the pressure drop.
That is a first approximation. Measurements on open-cell foams show that the pressure gradient can vary with sample thickness and tends towards a steady value as thickness increases. Very thin layers may therefore not scale exactly.
An Illustrative Estimate
Suppose a foam is measured at 10 mm thick and a face velocity of 1.0 m/s, with an initial resistance of 20 Pa. These numbers are hypothetical and chosen only for the calculation.
| Thickness (same foam, same velocity) | First estimate of initial resistance |
|---|---|
| 10 mm | 20 Pa (measured) |
| 20 mm | ≈ 40 Pa |
| 30 mm | ≈ 60 Pa |
Thickness vs PPI: Two Ways to Change Performance
A finer PPI and a greater thickness both tend to raise capture and resistance, but they are not interchangeable:
A thinner layer of a higher PPI and a thicker layer of a lower PPI may give similar initial resistance but different capture and dust-holding behavior.
A thicker layer adds dust-holding volume. A higher PPI makes the structure finer within the same volume.
A thicker layer needs more installation depth.
Combinations should be compared by testing them under the same conditions, not by assuming equivalence. Some filter designs also combine layers of different PPI to build up capture through the depth of the filter.
How 5 mm and 20 mm foams differ as product specifications is covered in Reticulated Filter Foam Specifications: PPI, Thickness, Sheets and Rolls. Whether a thicker pad fits the equipment is covered in Reticulated Foam Air Pre-Filters: Equipment Applications and Installation.
4. How Does Air Velocity Change Pressure Drop?
Short answer: Pressure drop across open-cell foam rises with air velocity, but not in a straight line. At very low velocities it is roughly proportional to velocity. At typical operating velocities a second, velocity-squared term becomes significant, so doubling the velocity more than doubles the pressure drop. A resistance value without its velocity cannot be compared or used for design.
The Darcy–Forchheimer Relationship
Flow through open-cell foams is commonly described by the Darcy–Forchheimer equation:
Δp / L = (μ / K) · v + β · ρ · v²
| Symbol | Meaning |
|---|---|
| Δp | Pressure drop across the foam |
| L | Foam thickness in the flow direction |
| v | Face velocity (air flow rate ÷ filter face area) |
| μ | Air viscosity |
| ρ | Air density |
| K | Permeability of the foam (Darcy term) |
| β | Inertial (Forchheimer) coefficient |
The first term dominates at very low velocities. As velocity rises, the second term, which grows with the square of velocity, takes a larger share of the total.Finer cell structures have lower permeability, which means higher pressure drop at the same velocity.
What This Means in Practice
Always state velocity with resistance. “40 Pa” has no meaning on its own. “40 Pa at 1.5 m/s, 20 mm thick, clean” can be compared.
Face area controls velocity. Face velocity equals air flow rate divided by face area. For example, 1,800 m³/h is 0.5 m³/s. Through a 0.5 m² face, that is 1.0 m/s. Through a 0.25 m² face, it is 2.0 m/s.
Velocity changes resistance more than in proportion. Because of the squared term, a filter run at twice its tested velocity can show well over twice its tested resistance.
Velocity also affects capture. Higher velocity strengthens impaction but raises resistance. A configuration should be evaluated at the velocity it will actually operate at.
Clean vs Loaded Resistance
Resistance figures usually refer to a clean filter. In service, resistance rises as dust accumulates. For design, the relevant questions are:
What is the clean (initial) resistance at the operating velocity?
How much resistance can the fan system tolerate before the filter must be cleaned or replaced?
How much dust can be held before that limit is reached?
Leakage around a poorly fitted pad also changes real-world performance, because air takes the path of least resistance. Fit and sealing are covered in Reticulated Foam Air Pre-Filters: Equipment Applications and Installation.
5. How Should Filter Foam Performance Data Be Compared?
Short answer: Compare performance data only when it was measured by the same method, at the same thickness, face velocity, test dust and loading state. Check whether a value describes the foam material or a complete filter, and whether it is initial or loaded. Values measured under different conditions cannot be ranked against each other.
Common Test References
| Reference | What it measures | What it tells you about foam |
|---|---|---|
| ISO 16890 (ISO Coarse group) | Filters with low fine-particle efficiency are classified by initial gravimetric arrestance with a standard test dust. Dust loading is mandatory for this group. | Arrestance and resistance of a complete filter under standard loading |
| ISO 16890 (ePM groups) | Efficiency against particle size ranges, e.g., ePM10 = 0.3–10 µm | Fine-particle efficiency of a complete filter |
| ANSI/ASHRAE 52.2 (MERV 1–4) | Lower MERV ratings are based on average arrestance using the method adopted from ASHRAE 52.1. | Arrestance-based rating of a complete filter |
| ASTM D3574 Test G | Air flow through a 50 × 50 × 25 mm specimen at a constant 125 Pa pressure difference | Material permeability, an indirect check on cell structure; not filtration efficiency |
Arrestance is a gravimetric measure: the share, by weight, of fed test dust that the filter retains. It is not the same as fractional efficiency at a particle size, and the two should not be compared directly.
Conditions to Record With Every Value
| Data point | Conditions that must accompany it |
|---|---|
| Initial resistance | Thickness, face velocity, air conditions, sample size or filter dimensions |
| Arrestance or efficiency | Test method, test dust or aerosol, particle size range, velocity, thickness |
| Dust holding capacity | Test dust, final resistance end point, face area, velocity |
| Material air flow | Test method, specimen size, pressure difference |
Using Data to Narrow Down a PPI and Thickness
Performance data is most useful when you start from the application’s limits rather than from a PPI number:
Define the capture requirement. Decide what share of what kind of dust the pre-filter needs to retain.
Define the resistance budget. Work out how much pressure drop the fan system can tolerate, both clean and at the end of service.
Calculate the face velocity from the air flow rate and the available face area.
Shortlist PPI and thickness combinations that are plausible for that velocity and the available depth.
Compare them under the same test conditions, ideally conditions close to actual operation.
Record the result so the selected configuration can be reordered precisely.
Our range: Our PPI-666 range covers a nominal 10–60 PPI in thicknesses from 3 to 50 mm. Performance-related values are discussed together with the conditions they were measured under: thickness, velocity, test method and loading state. Where your application depends on a specific value, we confirm what was measured before it is used in a design decision.How to verify that a supplier’s performance evidence is reliable is covered in How to Evaluate a Reticulated Filter Foam Manufacturer.
Reticulated filter foam captures dust through its depth, by several mechanisms at once, and its behavior depends on the full configuration, not on PPI alone.
PPI indicates direction, not a rating. A higher PPI generally means more capture and more resistance at equal conditions, but it is not a micron cut-off.
Thickness and velocity change performance. Resistance rises with thickness and faster than linearly with velocity.
Data needs its conditions. Compare values only when method, thickness, velocity, dust and loading state match
Review the listed PPI range, thicknesses and supply formats on our product page:
If you are comparing PPI and thickness options for a specific air flow, send us your air flow rate, available face area and depth, and any resistance limit. We will discuss which configurations are worth evaluating and what data is available for them.